black and brown leather padded tub sofa

Smart Fulfillment Solutions for Subscription Boxes

Optimize your subscription box logistics with real-time analytics and automated workflows.

Dynamic Inventory Management

Efficiently manage your inventory with real-time insights.

Automated Shipping Workflows

Streamline your shipping process for faster deliveries.
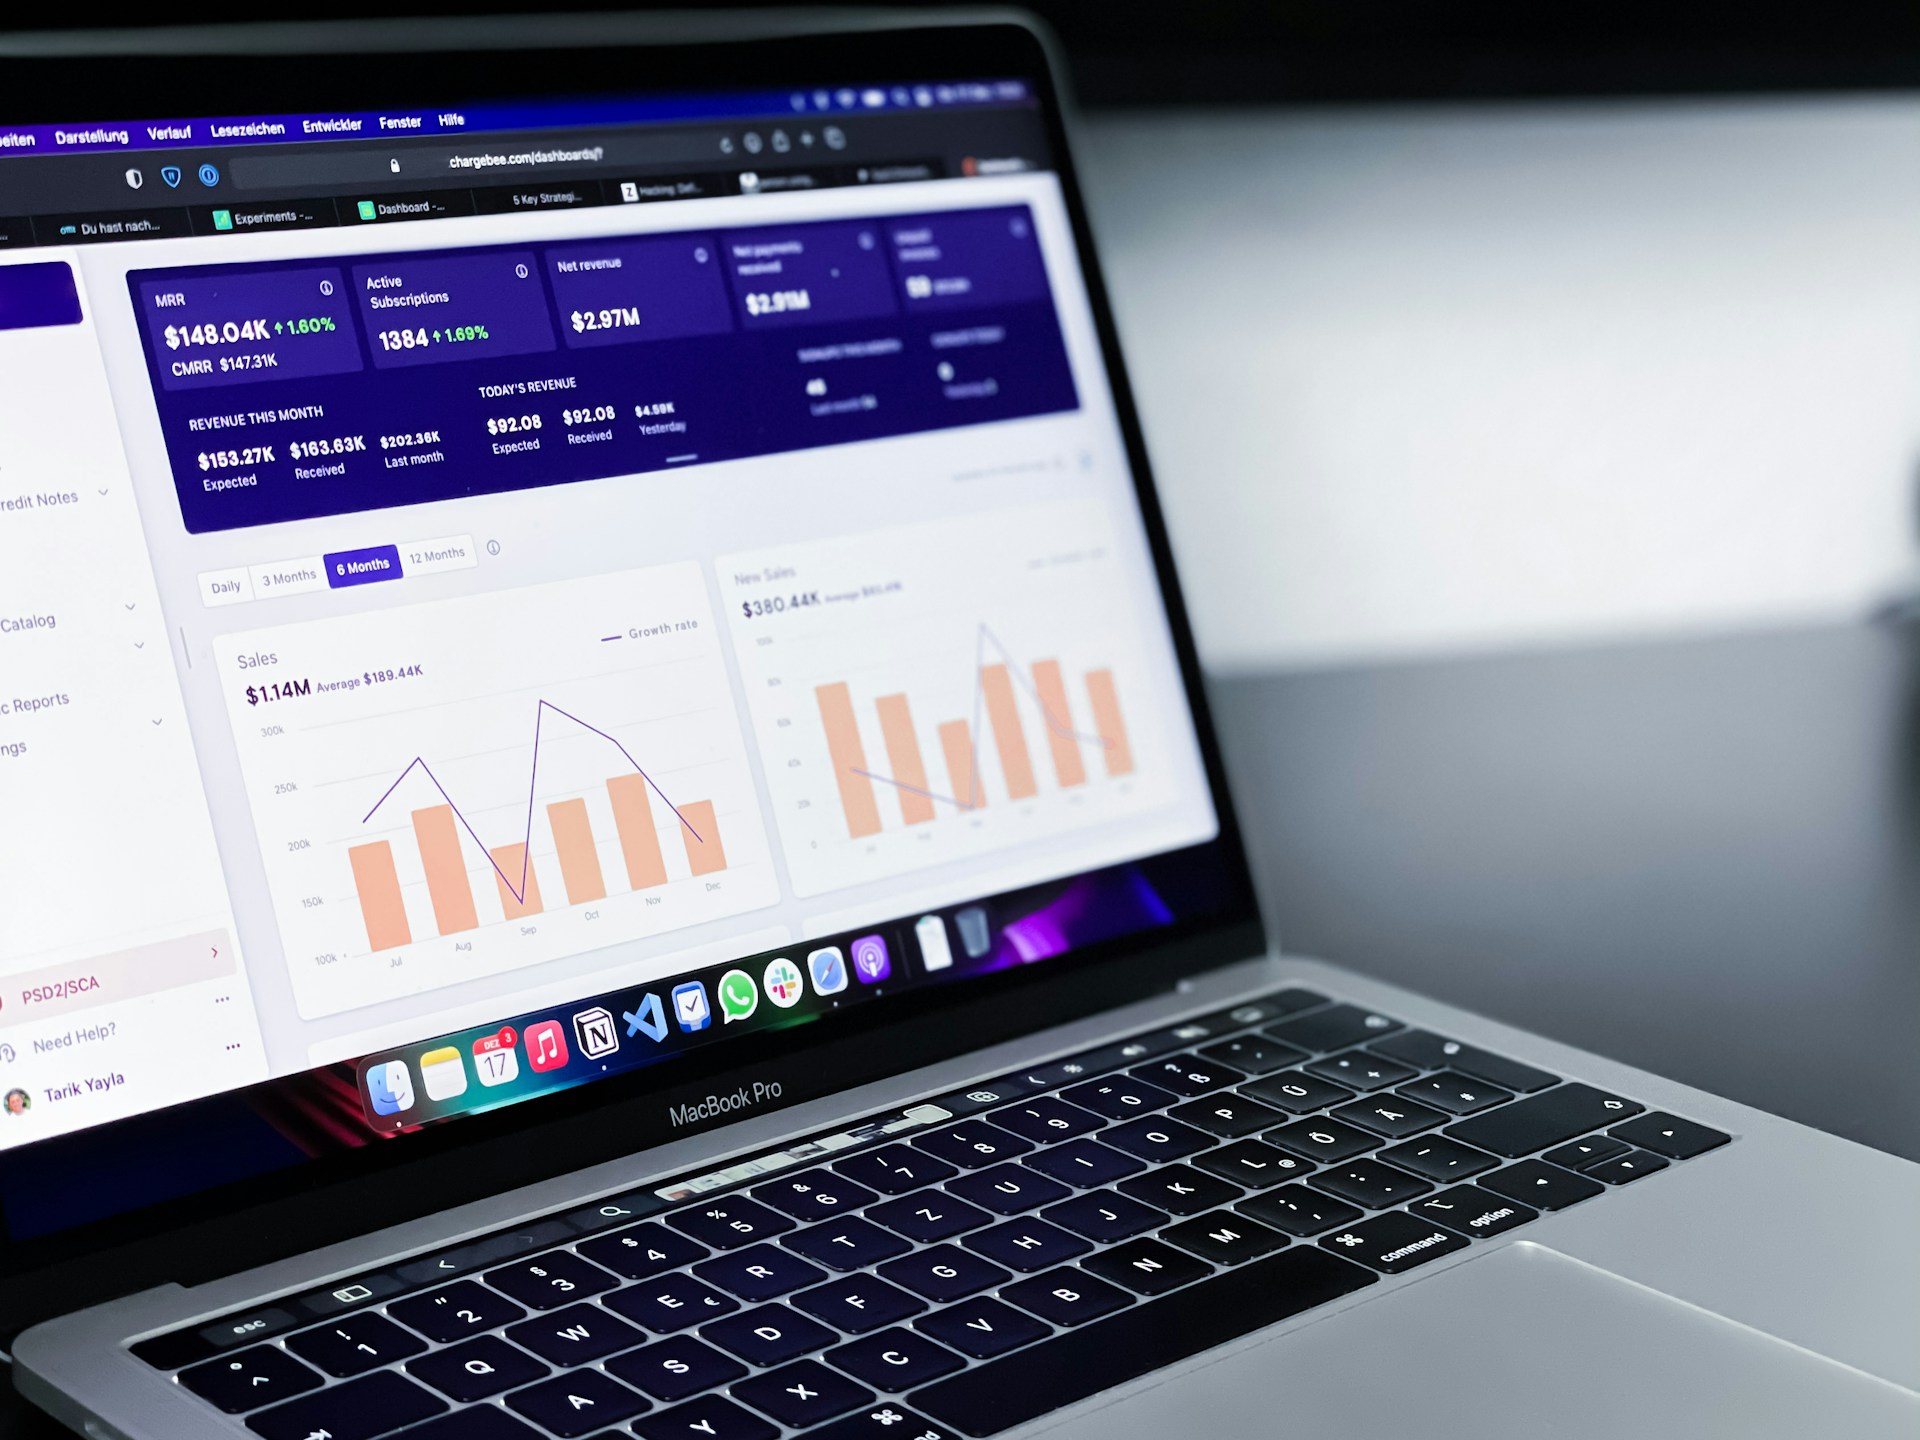
Real-Time Analytics
Track customer preferences effortlessly.

Welcome to Sublytics Fun

At Sublytics, we revolutionize subscription box logistics with data-driven insights, automated workflows, and dynamic inventory management for seamless fulfillment experiences.

A computer screen displaying analytics dashboards with various charts, including a line graph on the left and a cohort analysis table on the right. The table is populated with different shades of blue, indicating varying levels of user activity over several weeks. Text labels and numbers detail user retention statistics.
A digital dashboard displaying various analytics charts and graphs. There is a line graph showing user engagement over time on the left, a section with total revenue marked as $74K, and bar charts illustrating user statistics by region. The central section highlights users in the last 30 minutes, focusing on different countries such as the United States, Canada, India, Pakistan, and Brazil.
A computer screen displaying a data analytics dashboard with graphs and charts. A blue line graph shows fluctuations in data over time, and a section highlights the number of page views. A pie chart is partially visible, indicating a breakdown of different data elements.

About Sublytics Fun

We empower subscription box businesses with real-time analytics, optimizing packing processes and enhancing customer satisfaction while ensuring fun and stress-free operations.

Smart Fulfillment Solutions

Optimize your subscription box logistics with real-time analytics and automated shipping workflows tailored for you.

Dynamic Inventory Management

Efficiently track and manage your inventory to ensure timely deliveries and customer satisfaction every time.

A laptop screen displaying a subscription confirmation message. The message includes a title saying 'Thanks for subscribing!' and introduces profiles of three individuals with their photographs and brief descriptions. The user's hands are visible typing on the laptop keyboard.
Automated Shipping Workflows

Streamline your shipping processes with automation, reducing delays and enhancing the customer experience effortlessly.

Gain insights into customer preferences to curate boxes that delight and engage your subscribers effectively.

Customer Preference Tracking
A smartphone displaying subscriber statistics with a rising graph and specific numbers on a red background sits on a desk beside a silver laptop. A green plant leaf is partially visible on the left side of the image.
A delivery van with its back doors open, packed with numerous cardboard boxes of various sizes. A person is partially visible inside the van, surrounded by the boxes. The scene suggests the process of loading or unloading packages.

Sublytics has transformed our fulfillment process! The real-time analytics and automated workflows have made our subscription box business more efficient and enjoyable.

Emily R.

A smartphone displays analytics data with graphs showing views, downloads, and likes. It is resting vertically on a white dock next to a small potted succulent plant. In the background, a large computer monitor is partially visible, along with a closed laptop and a white wireless earbud case.

★★★★★

Get in Touch

Reach out to us for support, inquiries, or to learn more about our subscription box logistics solutions tailored to your business needs.

Contact
Support